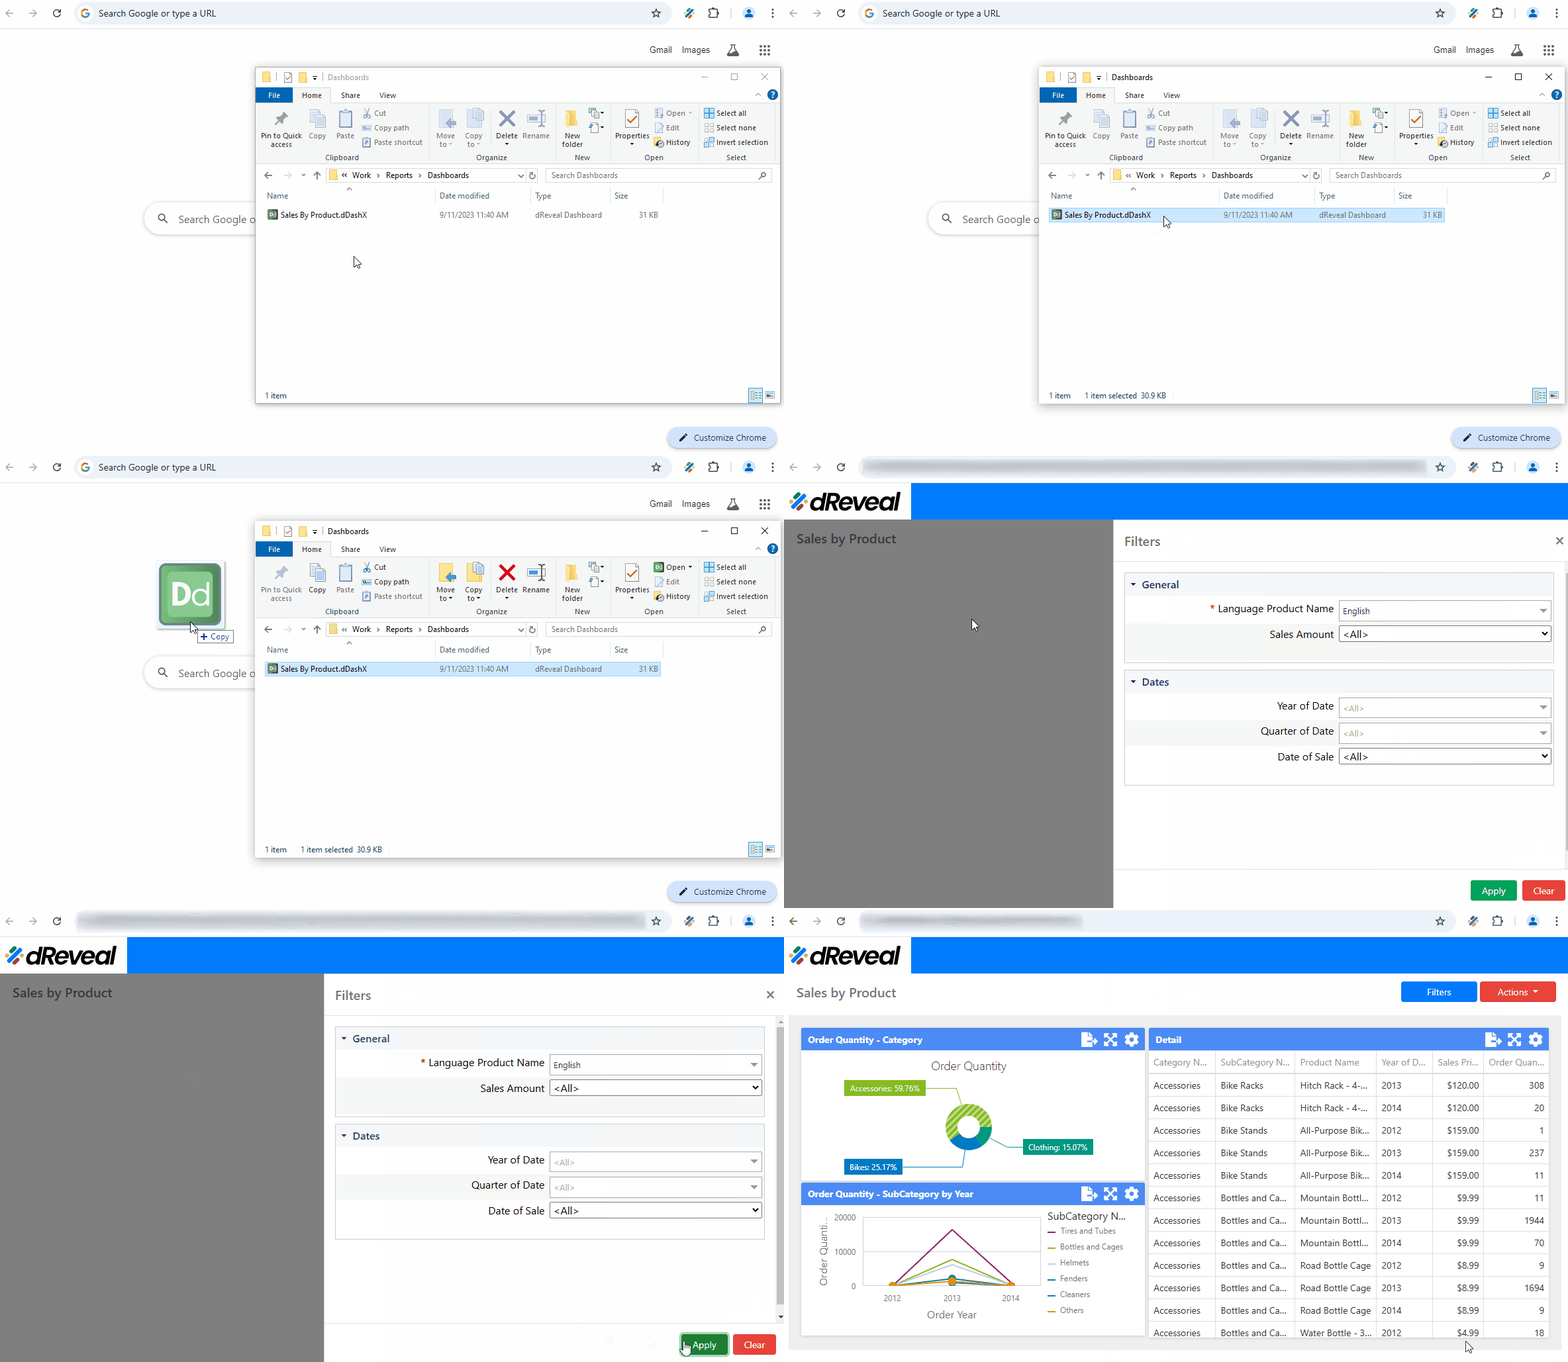
Dashboard Execution
Running a Dashboard report in dReveal Lite involves dragging and dropping the report into the browser. Users will be able to view the data from the executed report, apply filters, and get real-time updated information instantly. This process facilitates quick decision-making based on visual data.
When running a report, the first element that will appear is the filter panel. Once you select the desired filters, simply click the Apply button to load and view the corresponding information in the report.
How to Run a Report
To run a report, first make sure you have the report you want to execute. Then, open your web browser, either Google Chrome or Microsoft Edge. Next, select the Report and drag it into the browser, dropping it in the browser window. Once the report has loaded, the filter panel will appear. Then, select the desired filters and click the Apply button to view the report.

